I recently received my Reachy-Mini, and one of the first questions I had while running a sample project:
What would a real IDE experience for this robot look like?
Instead of the usual “SSH + scripts + terminal”, I wanted to challenge myself:
Could I build an IDE experience using Visual Studio Code as an ecosystem?
The goal for this Reachy-Mini IDE was:
- Remote access to Reachy Mini Wireless
- Easily execute programs in the Reachy Mini execution context
- Debug Python programs with breakpoints
- Capture realtime performance data inside the IDE (not full systrace, but enough realtime insights to understand the state of the robot)
- Keep it simple, no custom code, only ready made extensions
This post walks through my journey — what worked, what broke, and the end result I was able to achieve.
Graphical Remote File Access
Most robotics work matches working on embedded devices: you ssh into them, run some scripts, maybe tail logs, and hope things work. I wanted something more integrated, that matches closer to mobile development for Android or iOS:
Roughly, I wanted:
Plug in / connect → Open IDE → Code → Run → Debug → Observe Performance
So instead of copying files manually or running things blindly, I started with VS Code Remote – SSH functionality to develop directly on the robot.
Connecting was simple:
ssh pollen@192.168.0.151- Username:
pollen - Default password:
root
Once connected in VS Code, you can open any folder on the robot and work as if it’s local. That was already a quality-of-life improvement.
Performance Monitoring
When debugging robotics, insight into CPU & memory usage is just as important as logs.
So I added the SSH Remote Monitor extension.
This allows me to inline see:
- CPU usage
- RAM consumption
- system health
…directly inside VS Code while coding.
It’s not full systracing, but it’s enough realtime feedback to be meaningful, and it lives right where you’re coding.
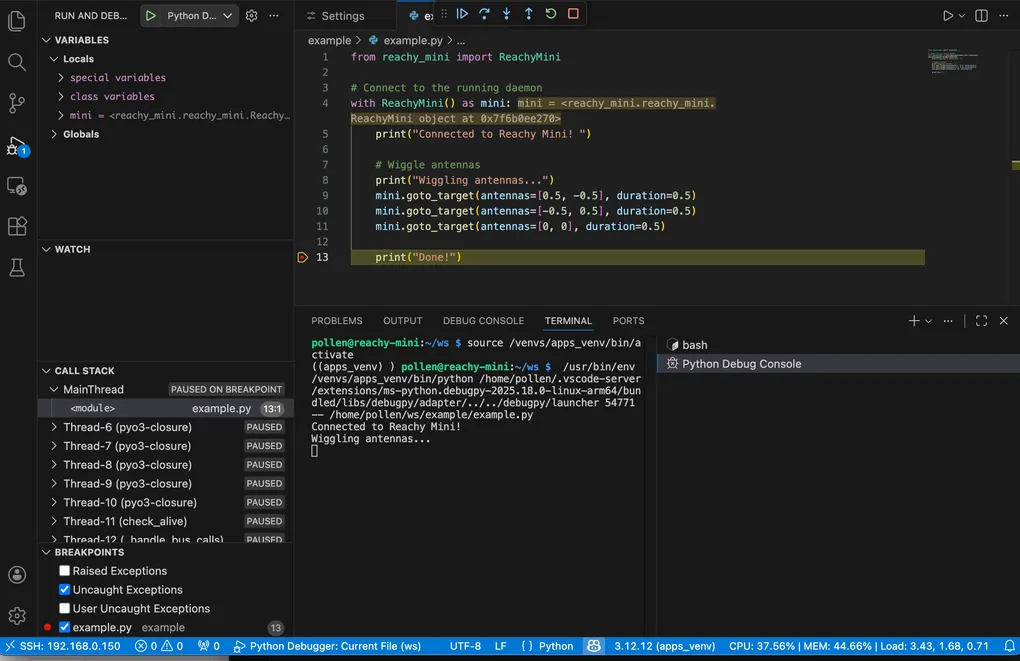
Debugging Python Programs
This was the trickiest but the most important part of the IDE experience.
Even if you have Python tools installed locally, they don’t automatically apply to the robot. VS Code runs debugging logic remotely, so the Python Debugger must also be installed on Reachy Mini.
If not, you’ll see something like:
This extension is disabled in this workspace, even if you have python installed on your development machine, because it is defined to run in the Remote Extension Host. Please install the extension in ‘SSH: 192.168.0.150’ to enable.
Solution:
- Open the extensions tab while connected to Reachy Mini
- Install the Python extension in the remote environment
Once installed, VS Code magically understands python and how to debug code running on the robot.
Using the Correct Python Interpreter (Critical for the SDK)
Reachy Mini has its own Python virtual environments, and using the wrong one means:
- SDK not available
- imports failing
- code running differently than expected
So we explicitly select the correct interpreter for running applications on Reachy Mini.
Open Command Palette:
Python: Select InterpreterThen choose:
/venvs/apps_venv/bin/pythonRunning with this interpreter:
✓ Activates the proper environment
✓ Ensures Reachy Mini SDK is available
✓ Matches the runtime used by the system
Now when you click Start Debugging, your breakpoints will actually be hit 🎯
Summary
At the end of this experiment, I had something that genuinely feels like a “Mini Reachy IDE”:
- Develop directly on the robot
- Monitor system performance live
- Debug Python remotely with breakpoints
- Use the correct SDK environment
- No hacks, no custom tooling
What started as a small experiment turned into something I’ll use daily.
Reachy Mini now feels less like a remote Linux box and more like a platform.
If you want to try it, or you’re building something similar, I’d love to hear how it goes.